The Lancet on Medicare for All: Optimistic Yet Depressing

This Lancet article gives an optimistic but plausible take on what would happen to health spending if we expanded the current version of Medicare to cover all Americans: a 13% drop in health spending.

Why Optimistic

The big problem I see in the article is that it claims to be evaluating what would happen if we passed the Sanders Medicare for All proposal, which involves changing current Medicare in a way that would make it much more expensive- removing coinsurance and deductibles. Removing cost-sharing would increase utilization for most everyone, not just people who are currently uninsured or “underinsured” (which they count at a combined 79 million); studies on Medigap insurance suggest this could raise spending 33% relative to standard Medicare. The Lancet study ignores this, but it would turn their predicted 13% spending reduction into a nearly 20% spending increase.

Why Depressing

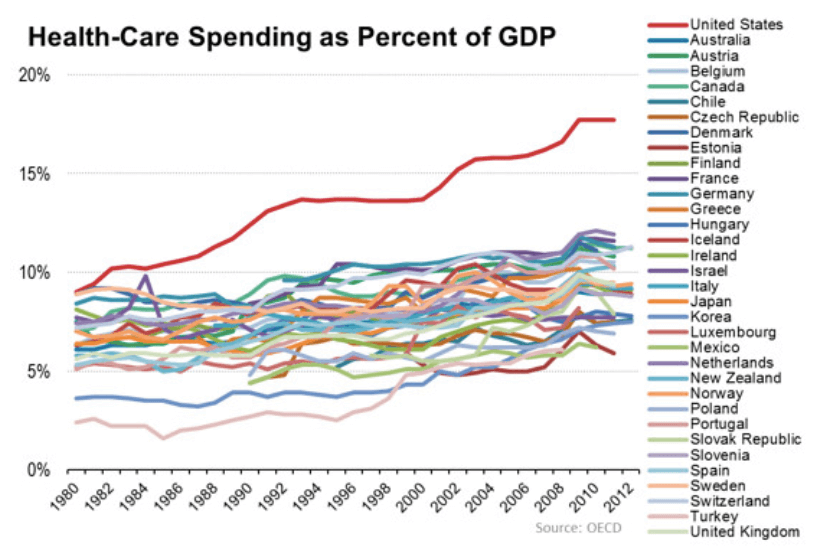
Still, I like having a study like this around, as it gives a clear presentation of what one version of Medicare for All might look like and where various savings and costs might come from. The depressing part is that even if all of their optimistic projections are true, and if a giant reform like Medicare for All actually happened, America would still have by far the highest health care spending in the world, with at-best average results. The latest OECD data shows the US spending 16.9% of GDP on healthcare, with Switzerland in a distant second place spending 12.2%. If Medicare for All, the biggest reform of the US health care system since at least 1965 and possibly ever, actually worked as predicted here, we would be spending 14.7% of GDP on health care- still far more than Switzerland or anywhere else (which makes sense as Medicare is costly by international standards). The article doesn’t put their mortality estimates into life expectancy terms, but the 68000 fewer annual deaths they predict represents a 2.4% drop; a 2.4% increase in life expectancy would bring us from 78.6 years to 80.5 years, still on the low end for rich countries.

This shows how our problems are bigger than just insurance and health financing, but even ‘just’ fixing the financing part (either with M4A or any other major reform) is unlikely.

Why It Won’t Happen

The authors argue that Medicare for all is politically feasible because, under their somewhat optimistic assumptions, the average American saves some money, while the average doctor and hospital roughly breaks even (Medicare generally pays less than private insurance but more than Medicaid and charity care), with the savings coming from lower administrative costs, lower fraud, and lower pharmaceutical prices. But I think this misreads the politics; while the Median Voter Theorem can be a good first approximation, the US political system tends to favor the well-off, special interests, and those who trying to maintain the status quo rather than change it. The paper itself makes clear who some of the losers from Medicare for All would be: private insurers, pharmaceutical companies, doctors and hospitals with a higher-than-average share of privately insured patients, and most people who spend a less-than-average share of their income on health care (which higher-income people tend to do; they also vote at higher rates). Further, “936,000 administrative positions and 746,600 positions in the health-care insurance industry are estimated to become redundant”. Many influential groups would suffer concentrated costs that would motivate dedicated lobbying effort against, while the largest benefits would be concentrated among the ~10% of Americans who are uninsured, who tend to be relatively poor. The ACA was a much smaller reform that did much more to buy off or otherwise placate most of these interest groups, and it still barely passed and lead to a huge political backlash, a lesson that at least some major relevant political figures took to heart.

What Happened to U.S. Health Spending After 1980? It Slowed Down.

In a NYT Upshot post titled Medical Mystery: Something Happened to U.S. Health Spending After 1980, Austin Frakt shows that US health spending pulled ahead of other countries in the 1980’s, and tries to explain this by looking for other ways the US was exceptional in the ’80s.

OECD

But looking at the RATE of spending growth rather than the absolute amount of spending tells a very different story. The US got to the top of health spending by rapid growth between 1960 and 1980; US spending growth actually slowed in the 1980s, and has slowed further since.

Average annual spending growth during 1960’s: 8.3%

Average annual spending growth during 1970’s: 6.0%

Average annual spending growth 1980’s: 5.4%

Real NHEA increase

So what happened before 1980? My main theory is, Medicare. Started in 1965 with cost-based reimbursement that incentivized hospitals to spend more, transitioned to a reformed payment scheme (Part A Prospective Payment) starting in 1983.

Average annual spending growth 1965-1983: 6.3%

Average annual spending growth 1984-2016: 4.1%

Numbers are my calculations from NHEA data and CPI. The most obvious counter to the Medicare theory is clear in the graph above: growth was even faster in the early ’60s before Medicare. Of course, I’m far from the first to point out the potential importance of Medicare or the 1983 reform. See Amy Finkelstein’s papers for the causal arguments (Introduction of Medicare, 1983 Reform), or this paper (summary) from CMS researchers that gives the best overview of historical US spending I’ve seen. I particularly like their table of US health spending ‘eras’:

US Health Spending Eras

US Health Spending Since 1960

As a health economist, I’m legally obligated to remind you that US health spending has more than tripled as a proportion of GDP since 1960. But while the “proportion of GDP” statistic is the one we share most often, I’m not sure its the most interesting. Total US Real GDP per capita has also tripled since 1960, implying that real US health spending per capita is actually 9 times the level of 1960.

The National Health Expenditure Accounts report that health spending was $10,739 per American in 2017. Their historical data goes back to 1960. Oddly, they don’t provide real inflation-adjusted spending figures themselves, so I calculated them using historical NHEA data and the CPI; you can get my spreadsheet here. I estimate that real per capita health spending in 1960 was $1212, just over 1/9th of current spending.

The sources of health spending have also changed dramatically since 1960, as you can see in these charts I made from NHEA data:

1960 spending pie

2017 spending pie

Spending has shifted from direct payments out of the pockets of patients/consumers, and toward insurance, especially public insurance (Medicare and Medicaid). Real out-of-pocket spending per American has merely doubled since 1960, while private insurance spending is 14 times its previous level, and public insurance is 58 times higher.

Why has spending increased so much? More coming soon…

Is the US Healthcare system responsible for our low life expectancy?

No. For life expectancy in developed countries, individual differences matter more than health systems.

The US is known for having below-average life expectancy for a developed country. This is true, but all generalizations about the US are wrong in important ways because the country is so huge and diverse (can I claim this as Bailey’s law? Or did someone else in our huge, diverse country already take credit?).

First there is huge variation across states, with average life expectancy ranging from at totally respectable 81.3 years in Hawaii to 75 years in Mississippi (putting it in the tier of much poorer countries like Iran, Brazil, or Sri Lanka).

Its common to blame low US life expectancy on “the US healthcare system”, but this can’t be right. Are the 12+ states with life expectancy of 80+ years not part of the real US health care system? Health policy is largely set at the federal level. Perhaps the exceptions are important, or for some other reason (more/better doctors?) the healthcare system really is better in those states. There is no “US healthcare system”, but rather 50+ US healthcare systems. Possible.

But there is also huge variation by race– from 74.6 years for African-Americans to 86.5 years for Asian-Americans. If Asian-Americans were their own country, they would have by far the longest life expectancy of any country in the world (currently Japan leads at 83.7). African-Americans, by contrast, would be down in the tier of middle-income countries, just as Mississippi was (though their life expectancy is still well above that of any sub-saharan African country, including relatively prosperous ones like South Africa and Botswana). Its also not a simple story of income differences- note that average Latino life expectancy in the US is 82.8 years, 3.9 years above whites (the Hispanic Paradox).

When we take advantage of the race-by-state cross-tabulations, we can really start to tell which stories about life expectancy have more merit. Asian-Americans maintain world-class life expectancies even while living in states near the bottom of the US rankings, like Alabama and Louisiana. If the problem were really about the health systems in those states being much worse than average, this would be hard to explain. One explanation I’ve heard from several other health economists is that the US healthcare system is actually good for most people, but bad for the ~20% who are poor and/or uninsured. This 20% does dramatically worse, skewing our overall average life expectancy downwards; and they are more concentrated in certain states, which explains the state-to-state variation. This sounds plausible and mostly matches the state variation, though it would mean the Hispanic Paradox remains a paradox; also, in Massachusetts blacks as well as Hispanics and Asians now outlive whites.

What explanations remain? Differences in health behaviors (e.g. diet, exercise, drug and alcohol use, medication adherence, accidents) are looking good. Genetics are possible too. Both could also explain why women live five years longer than men. My ad-hoc analysis here matches up with a lot of the more serious life expectancy research, for instance the research behind this tool you can use to calculate your personal life expectancy. Note how almost all of their questions are about your daily behaviors, and almost none are about interactions with the medical system.

Cod

The book is surprisingly great, mostly because I learned even more about history than about fish. Above all, that a lot of the original exploration of the North Atlantic was for fishing purposes; the Vikings were catching cod on their way to Greenland and North America and the Basques many have discovered America before Columbus and simply not told anyone so as not to give away their best fishing spot.

There was also some adventuring the other way by cod fishermen; in 1876 one sailed  across the Atlantic solo on a dare, from Gloucester to Wales. Later, another crossed the Altantic not only solo but single-handed, having previously lost his hand while cod fishing.

“The year after the Plymouth landing, 1621, while the Pilgrims were nearly starving, ten British ships were profitably fishing cod in New England waters”

Though the Pilgrims themselves were slow to recognize the value of marine resources- “In 1622, Bradford reported with shame that conditions were so bad for the settlers that the only ‘dish they could presente their friends with was a lobster'”

Once they finally did, “In Cod [New England] had a product that Europeans wanted…. this is what built Boston…. by the eighteenth century, Cod had lifted New England from a distant colony of starving settlers to an international commercial power.

“The entire Newfoundland economy was based on Europeans arriving, catching fish for a few months, and taking those fish back to Europe….. typical of the difference between New England and Newfoundland, Newfoundland imported Jamaican rum for local bottling, and still does, wheras New England imported molasses and built its own rum industry.”


Shoe Dog: Founding Nike

Many people recommended Phil Knight’s memoir about starting Nike; I found it entertaining and surprising. At first it seemed more like a cross between The Graduate and Zen and the Art of Motorcycle Maintenance than a business book.

It turns out that Knight didn’t set out to make Nikes, but rather to import existing shoe brands from Japan back in the 1960’s when Japan was a low-wage country. He had that idea in an entrepreneurship class at Stanford; his class project on it got an A, unlike every other business I’ve heard of that started in a classroom.

Knight says that he wasn’t a natural entrepreneur or CEO, and was terrible at sales and negotiating. So many of the key moves on the way to Nike becoming a multi-billion dollar company seem like blind luck. They only started making their own shoes 7 years into the business, then called Blue Ribbon Sports, after their Japanese supplier threatened to cut them off. A lot of key steps were taken by the first full-time employee, Johnson, without Knight’s knowledge or only after Johnson spent weeks persuading Knight- running their first ad, opening their first retail store, the very name Nike (Knight wanted to call the new shoes “Dimension 6”).

While I always saw Nike as driven by marketing and branding, the early executive team was made up almost entirely of accountants and lawyers; Knight actually worked elsewhere full time as an accountant and accounting professor through the early years of the company. Nike also seems to have driven a lot of true innovation in the shoes, much of it coming from co-founder Bill Bowerman (Knight’s college track coach).

I read this immediately after The Hard Thing About Hard Things, Ben Horowitz’ book about founding a tech company that sold for a billion dollars, and saw a lot of commonalities. Both founders thought they weren’t natural CEO’s, made lots of mistakes, and spent much of their time under extreme stress, convinced the business was within weeks of failure. To some people this might seem like encouragement to start a business (if they succeeded without knowing what they were doing, maybe you could too) but to me it was another indication that I’d never want to run a large business even if I were good at it (which I wouldn’t be). I always thought that the initial startup would be the most precarious time, but once you had millions in revenue and dozens of employees you’d feel more secure, like the business had made it and would be sticking around. In fact the existential crises seem to keep coming- key partners pulling away, new competitors emerging, a lawsuit, a threatening letter from the government, financiers cutting you off or making demands.

Another commonality was the importance of personal relationships within the company and with key customers and suppliers. Knight makes it sound like his executive team were his closest friends, drinking together every night. Any time one big company is doing a deal with another big company, there is usually one person on each side who is the key decision-maker, so it makes sense that they spend time together face-to-face. In Nike’s case, this meant lots of travel between Japan and the US. In Horowitz’ case, this meant spending $6 million while in a cash crunch to buy another company so that they could give away its software free to make that one guy (who from the outside was only a mid-level executive and not the obvious person to deal with) happy.

Both thought vulgarity and management not taking themselves seriously were important. “How many multimillion dollar companies can you yell out “Hey, Buttface” and the entire management team turns around?”

For Knight, a key to success was finding a cause he believed in, so that work didn’t feel like work:

Driving back to Portland I’d puzzle over my sudden success at selling. I’d been unable to sell encyclopedias, and I’d despised it to boot. I’d been slightly better at selling mutual funds, but I’d felt dead inside. So why was selling shoes so different? Because, I realized, it wasn’t selling. I believed in running. I believed that if people got out and ran a few miles every day, the world would be a better place, and I believed these shoes were better to run in. People, sensing my belief, wanted some of that belief for themselves.

The US Spends 3x the OECD average on Outpatient Care

You’ve probably heard that the US spends twice what other rich countries do on health care, and this is true. But we actually spend a normal amount on inpatient and long-term care, while spending more than three times as much as other rich countries do on outpatient care: 7.5% of GDP for the US vs 2.5% for the average OECD country. In fact, we spend more than twice as much as the next-highest-spending countries, Portugal and Switzerland, which each spend 3.5% of GDP on outpatient care.

I’m working on a book that will explore why we spend so much.

OECDoutpatientSpending

Source: OECD Health Statistics 2015


Want single-payer? Figure out how to fix Medicare.

The biggest barrier to single-payer in the US, other than politics, is the inefficiency of Medicare. Medicare alone spends more than $2000 per American but only manages to cover 14% of us. Yes, they are a particularly costly 14%- but some governments, like Greece and Portugal, manage to cover 100% of their population by spending similar amounts.

Medicaid spends just under $2000 per American and manages to cover 20% of the population. Together our two big government health programs spend about $4000 per American and cover 34% of the population. Almost every country with universal coverage manages to achieve it while their government spends less than $4000 per person.

This means that Medicare and Medicaid are collectively either 3 times better, or 3 times more inefficient, than the government health programs in other rich countries. Which do you think it is?

The problem isn’t that American taxpayers aren’t willing to finance universal coverage. The problem is that they already pay enough for a competent government to bring about universal coverage, but our government does not seem to qualify.

Stop Feeding the Trolls

So many of the problems of this decade could be fixed by people learning not to feed the trolls.
Most obviously, internet comment sections would only be half as terrible as they are now.
Donald Trump wouldn’t have got the nomination without the huge amount of free airtime from news channels covering his latest outrageous statement.

Growing political polarization is partly due to how the straw man / weak man fallacy is amplified by trolls. Many actual news stories are about the outrageous thing some random Twitter egg on the other side said.
Terrorism would be cut in half if shooting a bunch of innocent people weren’t the quickest way to get famous.
….
I just wish there were an easy way to fix this without censorship. The necessary culture change sounds incredibly difficult, but I hope that with time we will learn how to adapt to social media and 24 hour news.

For a start, I plan to never do terrorists’ jobs for them by sharing stories of their terror. I encourage my friends to do likewise.

Craft-Beer-O-Nomics

A new article in the Journal of Wine Economics gives an informative and interesting history of beer in the United States, with a special focus on craft beer. While they do some statistical analysis at the end, most of the article tells a story that everyone should be able to understand. I could give you the basics of the story but I think their graphs do that best:

Screen Shot 2016-01-06 at 2.27.46 PM

Screen Shot 2016-01-06 at 2.30.45 PM

We have gone from the dark ages of 1979 when Americans only drank Bud and Miller to the amazing variety of beer available today. Check out the article for stories of the people behind the craft beer revolution, and for an attempt to explain why it happened and why it happened in the states where it did.