
In a NYT Upshot post titled Medical Mystery: Something Happened to U.S. Health Spending After 1980, Austin Frakt shows that US health spending pulled ahead of other countries in the 1980’s, and tries to explain this by looking for other ways the US was exceptional in the ’80s.
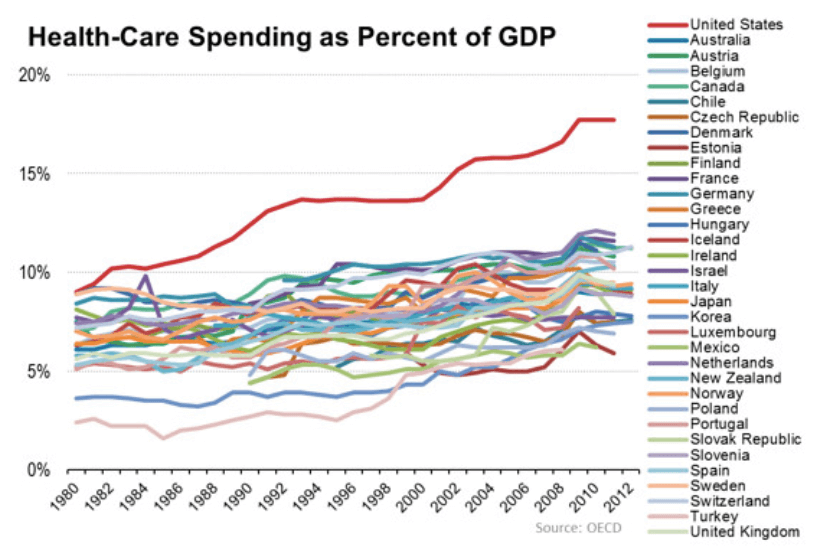
But looking at the RATE of spending growth rather than the absolute amount of spending tells a very different story. The US got to the top of health spending by rapid growth between 1960 and 1980; US spending growth actually slowed in the 1980s, and has slowed further since.
Average annual spending growth during 1960’s: 8.3%
Average annual spending growth during 1970’s: 6.0%
Average annual spending growth 1980’s: 5.4%

So what happened before 1980? My main theory is, Medicare. Started in 1965 with cost-based reimbursement that incentivized hospitals to spend more, transitioned to a reformed payment scheme (Part A Prospective Payment) starting in 1983.
Average annual spending growth 1965-1983: 6.3%
Average annual spending growth 1984-2016: 4.1%
Numbers are my calculations from NHEA data and CPI. The most obvious counter to the Medicare theory is clear in the graph above: growth was even faster in the early ’60s before Medicare. Of course, I’m far from the first to point out the potential importance of Medicare or the 1983 reform. See Amy Finkelstein’s papers for the causal arguments (Introduction of Medicare, 1983 Reform), or this paper (summary) from CMS researchers that gives the best overview of historical US spending I’ve seen. I particularly like their table of US health spending ‘eras’:

